Equal-Loudness Curves


Introduction: Amplitude and Loudness
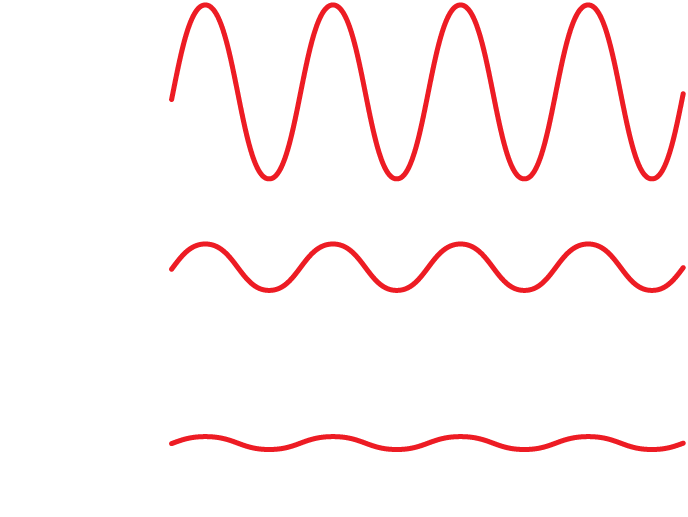
In general, the perceptual quality of sound loudness is determined by a physical property of sound waves: amplitude. For a sound wave of a certain frequency, as the amplitude increases, listeners perceive the sound as getting louder.
This is easily demonstrated. Click the bottom speaker in the illustration. You are now hearing a soft, 1000-Hz sine-wave tone. Adjust your computer’s sound output volume until you can just barely hear the tone. (Depending on your system, you may need to do this with an operating system control panel, a button on your computer itself, or a dial or button on your speakers or headphones.)
Now click the middle speaker in the illustration (but do not adjust the volume on your computer). The sound wave you hear now is the same frequency (1000 Hz), but its amplitude has been quadrupled. Therefore, you should hear it as sounding louder.
Click the top speaker in the illustration and the amplitude will increase even more (it will now be 16 times the original amplitude). Sure enough, you will perceive this sound as even louder.
As is so often the case, though, the situation is not quite as simple as the rule “higher amplitude = louder sound” would make it appear. To see why, move on to the next part of this activity.
Instructions
Use the menu to explore your audibility threshold and equal-loudness curves.
(Note: The sounds in this activity are intended to be heard through headphones, so they were recorded at a relatively low volume. Unless you have loud speakers connected to your computer, you will probably need to use headphones to hear the sounds properly.)
The Audibility Curve
Auditory researchers have long known that while loudness depends on amplitude, the amplitude necessary to produce a given loudness depends on the frequency of the sound wave being heard.
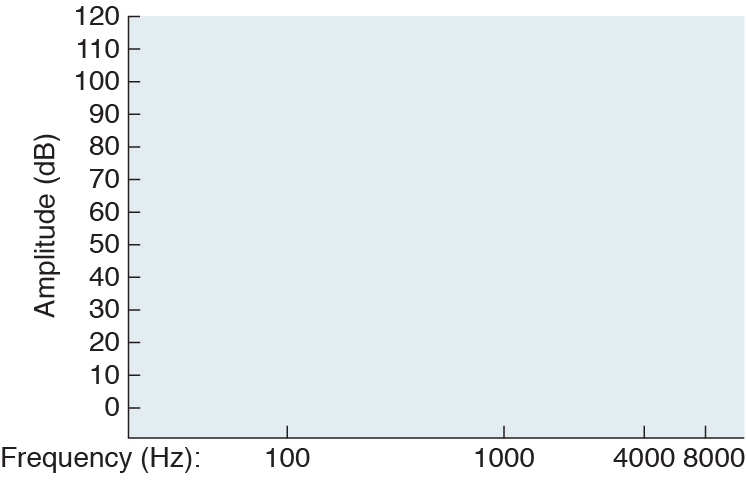
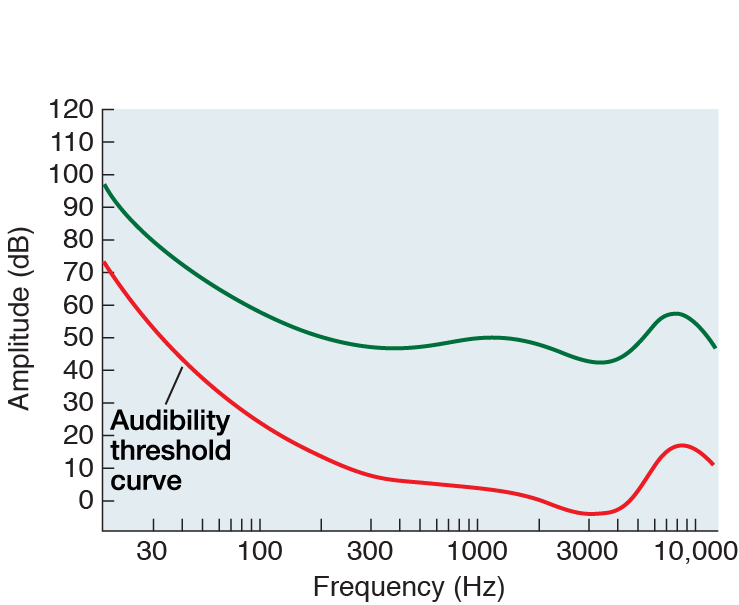
In this part of the activity, we’ll demonstrate this rule in action by estimating the shape of your audibility curve, which graphs the amplitude at which sound waves are barely audible for different frequencies.
To start, click the speaker below the “1000 Hz” tick mark on the x-axis of the graph at left. Assuming you just completed the first part of this activity and haven’t adjusted your computer’s volume, you should be hearing a 1000-Hz tone that is just loud enough to detect. (If you didn’t do the first part of the activity or have since adjusted your volume, adjust the volume again now so that the tone is just barely audible.) A marker now appears on the graph above the 1000-Hz tick mark. This represents the first point of your audibility curve.
Next, click the speaker below the “100 Hz” tick mark at left. You are now hearing a 100-Hz sound wave at exactly the same amplitude as the 1000-Hz tone you were hearing before, and a marker will appear on the graph to represent this stimulus. Can you hear the 100-Hz tone? Probably not. Click the up and down arrows next to the marker to adjust the amplitude of this sound wave until it is barely audible. (Do not adjust the volume on your computer; just use the arrows.) The marker on the graph will move up and down as you do so. When you have found the level that is just barely audible, the marker will indicate the second point on your audibility curve.
Now follow the same procedure for 4000 Hz and 8000 Hz: Click the speaker below each point on the graph, then click the arrows to adjust the amplitude, and stop when the tone is just barely audible.
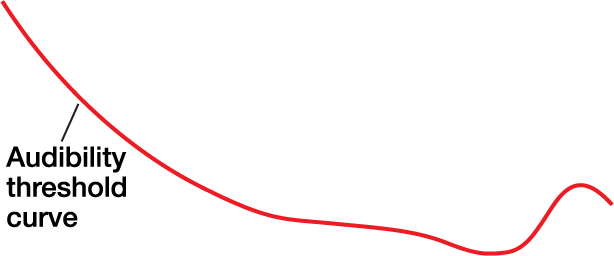
Once you have plotted all four points on the graph (100, 1000, 4000, and 8000 Hz), click the “Show auddibility curve” button to show the average audibility threshold curve (in red) established by auditory researchers (psychoacousticians) in laboratory experiments. Researchers tested their participants in a sound-proof room, used perfectly calibrated (and very expensive) headphones, and employed time-consuming psychoacoustic techniques to measure audibility curves. Since you are currently working under far less ideal conditions, the points you just plotted will probably not fall exactly on the theoretical audibility curve.
However, assuming your computer sound system is of decent quality, our experiment hopefully proved the main point: For different frequencies, the amplitude necessary to just barely hear the tone varies. Specifically, the 4000-Hz tone should have required the lowest amplitude to be audible, followed by the 1000-Hz tone, the 8000-Hz tone, and the 100-Hz tone.
In addition to the audibility curve described in the previous part of the activity, researchers have plotted similar curves for supra-threshold sounds (sound waves whose amplitudes are above the level where they can just barely be heard). One such curve is shown in blue in the image at left, above the red audibility curve.
To establish this equal-loudness curve, researchers generally use a 1000-Hz tone at a given amplitude as the reference tone, then ask listeners to adjust the amplitude of other frequencies so that their loudness matches the 1000-Hz tone. This is the same procedure we followed to map your audibility curve in the previous part of the activity. Thus, the audibility curve is really just the equal-loudness curve for just-barely-audible stimuli.
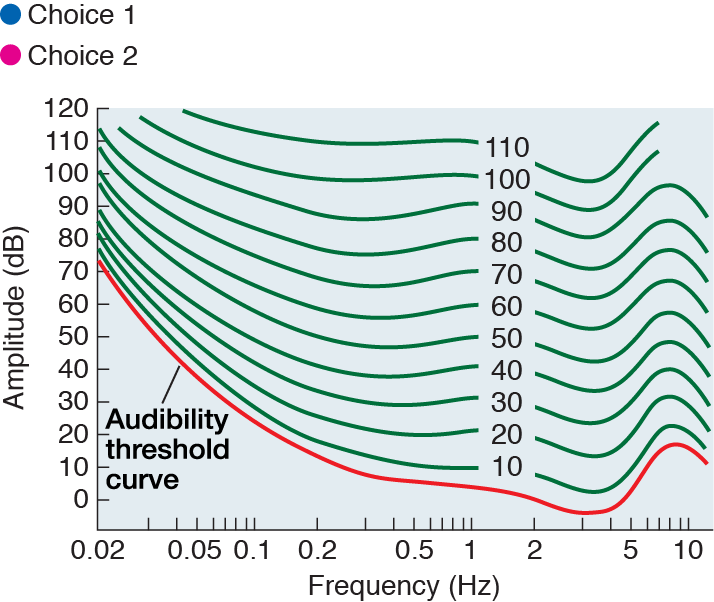
Click the “Show all curves” button to show a series of equal-loudness curves established by auditory researchers. As you can see, the curves get shallower as they go up, but the general shape remains the same.
A couple of notes about the graph we’ve been using in this activity:
- The x-axis uses a logarithmic scale to represent sound-wave frequencies. Thus, the distance on the scale between 100 (101) Hz and 1000 (102) Hz is the same as the distance between 1000 Hz and 10,000 (103) Hz. Logarithmic scales are convenient to use when we need to represent a large range of values on a graph.
- The unit of measurement for sound-wave amplitude on the y-axis is the decibel (dB). Remember that a sound wave is really a repeating change in air pressure (e.g., for a 10-Hz tone, pressure goes up then back down 10 times per second; for a 1000-Hz tone, pressure goes up and down 1000 times per second). The formula for converting the maximum change in pressure p for a sound wave into decibels is:
dB = 20 log(p / p0)
where p0 is defined as 0.0002 dyne/cm2. This arbitrary-looking standard was chosen because it corresponds to the amplitude of a 1000-Hz sound wave that can just barely be heard by most people. In other words, decibels are defined so that the 1000-Hz point on the audibility curve is exactly 0 dB.
In this part of the activity you will be asked to judge, on the basis of the equal-loudness curves at left, which of two sounds would be perceived as loudest.
Note that we have changed the scale of the x-axis to kilohertz (kHz), where 1 kHz = 1000 Hz, 0.1 kHz = 100 Hz, and 10 kHz = 10,000 Hz. Also, we have labeled the equal-loudness curves with numbers to make them easier to refer to. The number in the label indicates the decibel level of the 1000-Hz tone used as the reference for that equal-loudness curve.
Quiz Question 1
Which of the following two sounds would be perceived as louder? (Click on your choice.)
If you need help, you can show these two points on the equal-loudness curve graph.
Answer to Quiz Question 1
Correct!
For a given frequency, the higher the amplitude of a sound wave, the louder it is. Therefore, since the two sounds in this question have the same frequency (800 Hz, 0.8 kHz), the 800-Hz/20-dB tone (represented by the blue spot on the graph at left) will sound louder than the 800-Hz/10-dB tone (represented by the green spot).
Answer to Quiz Question 1
Incorrect.
For a given frequency, the higher the amplitude of a sound wave, the louder it is. Therefore, since the two sounds in this question have the same frequency (800 Hz, 0.8 kHz), the 800-Hz/20-dB tone (represented by the blue spot on the graph at left) will sound louder than the 800-Hz/10-dB tone (represented by the green spot).
Quiz Question 2
Which of the following two sounds would be perceived as loudest (click on your choice):
If you need help, you can show these two points on the equal-loudness curve graph.
Answer to Quiz Question 2
Incorrect.
These two sound waves have the same amplitude, but they fall on different equal-loudness curves: the 60-Hz/40-dB tone (blue) is on the curve marked “10” (hence it sounds equally loud to a 1000-Hz tone at 10 dB), whereas the 300-Hz/40-dB tone (green) is on the curve marked “40.” The higher the equal-loudness curve, the louder the sounds on that curve are perceived to be, so the 300-Hz/40-dB tone will be heard as loudest.
Answer to Quiz Question 2
Correct!
These two sound waves have the same amplitude, but they fall on different equal-loudness curves: the 60-Hz/40-dB tone (blue) is on the curve marked “10” (hence it sounds equally loud to a 1000-Hz tone at 10 dB), whereas the 300-Hz/40-dB tone (green) is on the curve marked “40.” The higher the equal-loudness curve, the louder the sounds on that curve are perceived to be, so the 300-Hz/40-dB tone will be heard as loudest.
Answer to Quiz Question 2
Incorrect.
These two sound waves have the same amplitude, but they fall on different equal-loudness curves: the 60-Hz/40-dB tone (blue) is on the curve marked “10” (hence it sounds equally loud to a 1000-Hz tone at 10 dB), whereas the 300-Hz/40-dB tone (green) is on the curve marked “40.” The higher the equal-loudness curve, the louder the sounds on that curve are perceived to be, so the 300-Hz/40-dB tone will be heard as loudest.
Quiz Question 3
Which of the following two sounds would be perceived as loudest (click on your choice):
If you need help, you can show these two points on the equal-loudness curve graph.
Answer to Quiz Question 3
Correct!
Neither of these two sounds fall exactly on any of the plotted equal-loudness curves. However, if you look carefully you will see that the 5000-Hz/70-dB tone (blue) falls above the curve marked “70,” whereas the 1000-Hz/65-dB tone (green) falls below the same curve. Therefore, we can infer that the 5000-Hz/70-dB tone will sound louder.
Answer to Quiz Question 3
Incorrect.
Neither of these two sounds fall exactly on any of the plotted equal-loudness curves. However, if you look carefully you will see that the 5000-Hz/70-dB tone (blue) falls above the curve marked “70,” whereas the 1000-Hz/65-dB tone (green) falls below the same curve. Therefore, we can infer that the 5000-Hz/70-dB tone will sound louder.