Fourier Analysis
Introduction: Simple and Complex Tones
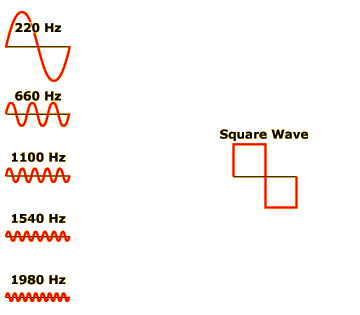
A simple tone is a sound wave whose pressure level follows a sinusoidal pattern over time (hence the alias sine wave tone), as illustrated in the figures at the far left. Click the top-left speaker to hear a simple tone that cycles through high pressure peaks and low pressure valleys 220 times per second.
Click the second speaker from the top to hear a different tone that has a different frequency; it goes through 660 cycles per second, and is therefore designated a 660-Hertz (Hz) tone.
Click the other speakers to play 1100-Hz, 1540-Hz, and 1980-Hz tones, and you will discover a general rule about sound wave frequencies: as frequency increases, the psychological quality we call tone also increases.
Pure sine wave tones are almost never heard in the real world. The auditory world outside psychological laboratories and perception courses is composed of complex tones like the square wave you can hear by clicking the speaker on the right side of the figure.
If you never actually hear them, why did we just bother having you learn about simple tones? Because it turns out that any complex tone can be decomposed into a series of simple tones. The mathematical process of calculating a complex tone’s simple tone components is called Fourier analysis. In this activity, we’ll first see how a complex tone can be built from simple tones. Then we’ll illustrate the Fourier analysis process. Finally, we’ll see how the human cochlea performs a form of Fourier analysis every second of your waking life.
Instructions
Click the speaker icons to play various sounds. (Clicking the speaker again will stop the sound.)
Building a Complex Tone
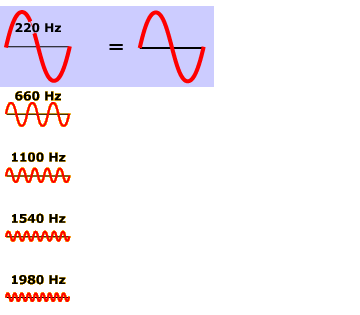
Listen carefully to the 220-Hz sine wave sound and the square wave sound again. You should hear a fundamental similarity between the two: they have the same tone. The reason they have the same tone is that their pressure changes repeat at the same frequency (220 Hz), as represented in their images.
The perceptual quality that distinguishes these two sounds is called timbre, which we devote Activity 10.3 to exploring. For now, though, we’ll investigate how adding additional sine wave sounds can produce new complex sounds that are perceived as more and more similar to the square wave.
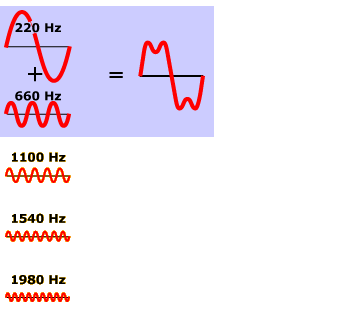
Click the second speaker down on the left side. What you are now hearing is a combination of the 220-Hz sine wave tone and the 660-Hz sine wave tone. The 660-Hz tone gives a little “edge” to the sound wave that you can hear and also see in the visual representation of the sound wave mixture. Click the other speakers to add the 1100-Hz, 1540-Hz, and 1980-Hz tones into the mix, and this edge will grow sharper and sharper, approximating the timbre of the square wave tone more and more closely.
Math whizzes will have noticed that 660, 1100, 1540, and 1980 are exactly 3, 5, 7, and 9 times 220. These particular tones were not chosen randomly. It can be mathematically proven that if you take a sine wave tone with any base frequency f and add in extra tones at frequencies 3f, 5f, 7f, 9f, 11f, 13f, 15f, ..., all at the right amplitudes, you will end up with a perfect square wave tone.
Fourier Analysis: Breaking Down a Complex Tone
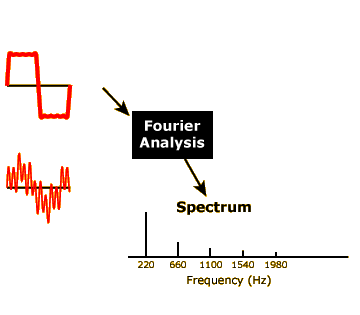
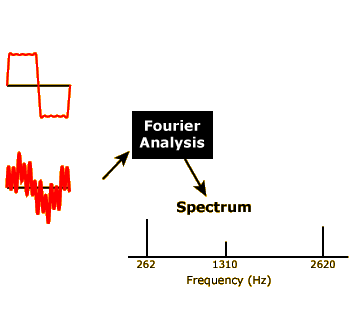
A mathematical procedure called Fourier analysis takes any complex tone and breaks it down into its simple tone (i.e., sine wave) components. In this part of the activity, our Fourier analyzer is represented by the black box in the middle of the figure at left. Click on the top speaker to put the complex tone we built in the previous part of the activity through this black box. What comes out the other side is a new representation of the complex tone called a Fourier spectrum.
In a spectrum graph, frequencies are represented on the x axis and amplitude is represented on the y axis. Thus for this tone, we see the tallest bar at 220 Hz, then progressively smaller bars (representing components with progressively smaller amplitudes) at the 660 Hz, 1100 Hz, 1540 Hz, and 1980 Hz positions.
Click the bottom speaker to analyze a new complex tone, represented by the considerably messier curve next to the speaker. As our Fourier analyzer shows us, this tone is composed of a high-amplitude component at 262 Hz, a somewhat lower-amplitude component at 2620 Hz, and an even lower-amplitude component at 1310 Hz. Despite the apparent complexity of the tone in the graph on the left, the Fourier analysis of the sound reveals that is made up just of three simple components.
Fourier Analysis in the Cochlea
Fourier analysis is incredibly useful to acoustical engineers and auditory researchers, but it is also of interest to us in this course because the cochlea in our inner ears (see Activity 9.2: Structure of the Auditory System) effectively performs a Fourier analysis on every sound we hear. This part of the activity demonstrates how this works.
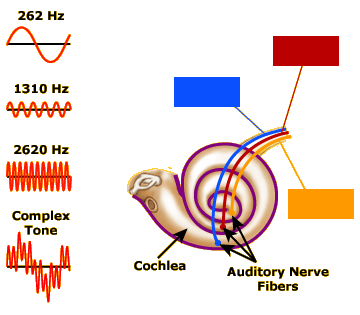
As illustrated in the diagram at left, auditory nerve fibers (ANFs) are positioned all along the length of the rolled-up cochlea. Like all neurons, even when they’re not being stimulated, these ANFs are constantly firing action potentials at a resting rate. These resting rates are represented by the blue, red, and orange spike trains in the diagram.
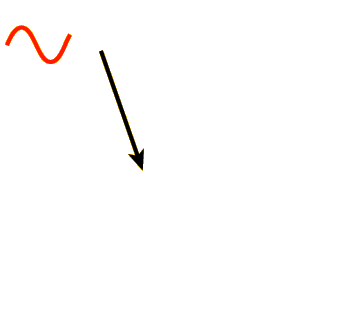
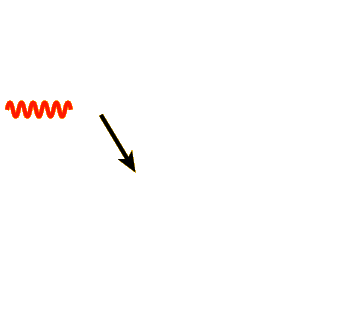
Now click on the top speaker to play a 262-Hz sine wave tone. You will see the firing rate of the orange ANF increase dramatically. Next click the second speaker from the top, which will play a solo 1310-Hz tone. The orange ANF calms back down to its resting rate, but now the red ANF starts firing slightly faster than it was before. (It fires at a slower rate than the orange ANF did because the 1310-Hz tone is being played at a lower amplitude than the 262-Hz tone was.) Similarly, clicking the third speaker from the top plays the 2620-Hz tone and activates the blue ANF alone.
Thus, it looks like the orange ANF is a detector for 262-Hz simple tones, the red ANF is a detector for 1310-Hz tones, and the blue ANF is a detector for 2620-Hz tones.
Now click the bottom speaker to play the complex tone (composed of simple tones at 262, 1310, and 2620 Hz) that our black-box Fourier analyzer broke down in the previous part of the activity. As you see, our cochlea does a very similar thing here: in response to this complex tone, the three ANFs respond at the same rates that they did to the simple tones in isolation. The brain can then process the pattern of firing rates across all the ANFs in the cochlea to determine the simple components of any complex tone.
