Gabor Patches
| Spatial Frequency | Contrast |
|
High Medium Low |
Introduction
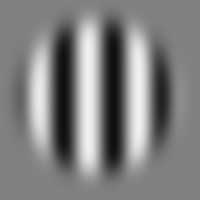
The image at left shows a Gabor patch—a sine wave grating seen through a Gaussian window. Gabor patches are popular stimuli in vision laboratories because they have characteristics that match the receptive field properties of neurons in primary visual cortex.
Instructions
Click on a radio button to change the spatial frequency or contrast of the Gabor patch at left. Read about various features of Gabor patches by clicking on the links in left menu. For some features, clicking on the Gabor patch itself will switch between two different images.
Sine Wave Grating
A sine wave grating is an image in which light intensity alternates between its brightest and darkest values according to a sine function. The image at right illustrates a sine wave function, and at left you see this function superimposed on the Gabor patch. As you can see, the intensity cycles from its brightest value (white in a high-contrast grating) through a series of intermediate grays, to its darkest value (black in a high-contrast grating), and then back to white again.
Gaussian Window
At left you see a sine wave grating alone. Sharp edges are formed where the grating meets the background, and in an experiment, these sharp edges could confuse a neuron. The edges can be eliminated by multiplying the grating by a Gaussian window, which causes the grating to blend in with the background. The Gaussian function is also known as the “normal curve” or the “bell curve” and is depicted on the right.
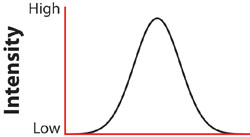
Click the sine wave image at left to toggle back and forth between the grating with and without the Gaussian window. You will see that the image’s intensity is highest in the middle and decreases towards the edges, just as the Gaussian function does.
Spatial Frequency
One important property of a Gabor patch is the spatial frequency of its sine wave grating. Spatial frequency is usually measured in cycles per degree: the number of times the sine wave repeats within one degree of visual angle. The image at right illustrates a cycle, and at left, two cycles of the grating are highlighted in green.
Remember that visual angle is determined by the size of an object and the distance of the object from your eye. Also remember that your thumbnail held at arm’s length subtends about 2 degrees of visual angle. So if you hold your thumb out at arm’s length and move back until your thumb just covers the green horizontal line (2 cycles) in the image at left, you will be viewing a 1 cycle/degree Gabor patch. At this viewing distance:
- The “Highest” spatial frequency patch is 12.5 cycles/degree.
- The “Medium-High” patch is 6.25 cycles/degree.
- The “Medium” patch is 2.5 cycles/degree.
- The “Medium-Low” patch is 1 cycle/degree.
- The “Lowest” spatial frequency patch is 0.5 cycles/degree.
Contrast
The contrast of a Gabor patch’s sine wave grating refers to the intensity difference between the lightest and darkest portions of the patch, as illustrated in the graphs below.
In a high contrast patch, the lightest regions of the image are white and the darkest regions are black. In a low contrast patch, the lightest regions are light gray and the darkest regions are dark gray.
Click the radio buttons labeled “High,” “Medium,” and “Low” to see for yourself.
Phase
The phase of a Gabor patch refers to the relative position, or shift, of the sine wave from left to right. The graph below illustrates the phases of a sine wave, from 0 degrees through 90, 180, 270, and back to 0 degrees. At left you see a patch cycling through its phases, which makes it appear to move laterally.