Timbre
Introduction
The perceptual quality called timbre is defined by what it isn’t. If tones have the same pitch and loudness, but you perceive them as different, then the tones differ in timbre.
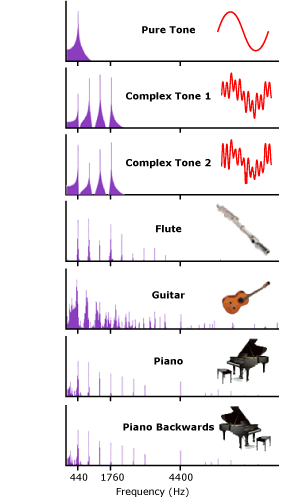
This activity includes six tones that fit this description. As you know from the text and the activity on missing fundamentals, pitch is determined by the fundamental frequency of a sound. The purple spectrograms in the figure at left show that all six sounds have the same fundamental—440 Hz (this is a middle A note), so you will hear all of them as having the same pitch. The intensities of the six sounds are also roughly the same.
Despite the fact that the six sounds are all the same note, you will nevertheless have no difficulty distinguishing the tones, and your ability to distinguish them is based on the tones’ timbres.
Instructions
Click each speaker to play the tones and read a short description.
Pure Tone
You are now hearing a pure tone—a sine-wave sound like those we’ve heard in a number of other activities—playing a middle A note. Use this as a reference for comparing the timbre of the other tones.
Complex Tone 1
You are now hearing complex tone 1, composed of the fundamental frequency (440 Hz) along with the first three harmonics (880, 1320, and 1760 Hz). This should sound like a more embellished version of the middle A note.
Complex Tone 2
Complex tone 2 is very similar to complex tone 1—they are both the note middle A. As you can see by its spectrum, complex tone 2 contains the same four components (440, 880, 1320, and 1760 Hz) as complex tone 1. The only difference is that the relative intensities of the components differ. In complex tone 2, the fundamental and third harmonics (i.e., the first and fourth spikes) are relatively louder than in complex tone 1, while the first and second harmonics (i.e., the second and third spikes) are relatively softer.
This factor, the relative strength of harmonics, is one of the primary determiners of timbre. The pattern of relative strengths is sometimes called the “spectral shape,” after the curve traced out by the tops of the bars in the frequency spectrum.
Flute
This is the sound of a flute playing our middle A note (actually, this, like all the other sounds you’re hearing in this activity, is a computer-synthesized sound). The flute is notable for its “clean” timbre—of all the orchestral instruments, the flute (or its relative, the piccolo) probably sounds closest to a pure tone.
Guitar
Now you’re hearing the pluck of a guitar string. Note the considerably “messier” frequency spectrum compared to the flute, which results in a more complex timbre. In this sound, you can also hear a change over time. The spectral shape of the guitar’s tone changes considerably over the course of the plucking sound.
Piano
This is a synthesized piano note. Its timbre might be classified as something between the clean flute sound and the more complex guitar sound.
Piano Backwards
Here, you are hearing the same piano note as before, but the sound has been manipulated by computer software so that it is being played backward.
As the frequency spectra show, across the entire span of the sounds, the frequencies in the forward and backward piano tones are identical. The reason that the two tones sound so different is that the frequencies first rise and then fall in intensity in the forward version but do the opposite in the backward version. The intensity build-up and release are called the attack and decay of a sound, respectively. Inverting the tone inverts the attack and decay for each frequency component, resulting in a very different overall effect. (It is an open question whether attack and decay characteristics are part of a sound’s timbre or whether they are separate sound qualities.)
