Auditory Localization Cues
Introduction
Note: You will need to listen to your computer’s sound output through headphones for the demonstrations in this activity to work.
Regardless of where a sound source is located, pressure waves enter your ears through the same two paths—the auditory canals. This makes locating objects on the basis of audition considerably more difficult than locating them on the basis of vision (and accounts for why the first thing you usually do when you hear a novel stimulus is turn your head so you can get a good look at it).
Nevertheless, auditory localization is possible, and can be quite accurate, because of a set of three cues we can derive based on the anatomy of our auditory system:
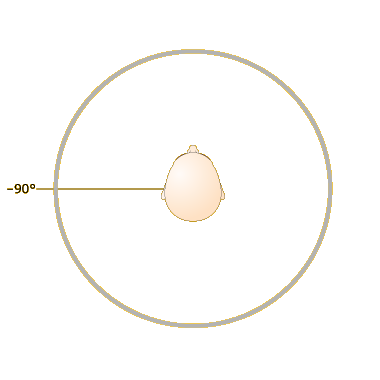
- Since the two ears are separated from each other by the rest of your head, sound waves reach one ear (purple line in the figure at left) slightly before they reach the other ear (red line). This interaural time difference (ITD) is systematically related to the angle at which the sound source is located relative to your head.
- The head also casts a “sound shadow” over one of the ears (see figure), making the amplitude of the sound wave entering one auditory canal slightly smaller than the amplitude entering the other ear. This interaural level difference (ILD) is, again, systematically related to the angle between the sound source and your head.
- Finally, the bumps and dips of your pinna (see figure inset) alter the amplitudes of sound waves in complex ways that are once more systematically related to where the sound source is coming from.
In the first two parts of this activity, we will simulate the ITDs and ILDs for sound sources located at 15° increments around your head, so that you can get a sense for the effectiveness of these two cues in helping you determine where sounds are coming from. In the third part, you will be able to compare the effects of both cues separately and combined. (Unfortunately, we cannot simulate the effects of the pinna cues here, because to do so would require plaster casts of your ears!)
Interaural Time Differences
Remembering to put your headphones on first.
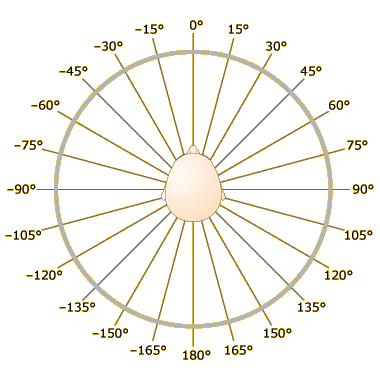
Click on the speaker at center-top—the one labeled 0°—in the figure at left. You will hear 440-Hz sine wave tones coming through both your left and right headphones. Now click the right-middle speaker, labeled 90°. Now the tones entering your two ears are identical in frequency and amplitude to the previous ones, but the sound wave entering your left ear is delayed by 640 microseconds (μs; 1 μs = one millionth of a second).
640 millionths of a second isn’t very long, but you should find that this delay nonetheless changes your perception quite dramatically. You should now perceive the second tone as coming from the right side of your head, whereas the first tone should have been perceived as coming from directly in front of you. Click the speakers going from 90° to 75° to 60° and on back up to 0° and you should perceive the sound source as rotating towards the front of your head (the ITDs will be shown in the upper left of the window). If you move over to the speakers labeled as negative angles, the sound source should shift to the left side of your head.
Now try the speaker labeled 180°. The stimulus you’re hearing now is perfectly simulating the ITD for a sound source located directly behind you. You may not notice any difference between this stimulus and the one you hear when you click on the 0° speaker. That’s because there is no difference—the stimuli are identical!
If you think about it a minute, you should be able to see that a sound projecting from directly behind you will reach your two ears at exactly the same time (resulting in an ITD of 0), just as a sound coming from directly in front of you will. A sound coming from directly above or below you will also produce an ITD of 0.
Similarly, sounds projecting from 15° and 165° will also produce identical ITDs, as will sounds from 30° and 150°, 45° and 135°, and so on. These ambiguities reflect what auditory researchers call cones of confusion—sets of points that are indistinguishable on the basis of ITDs (or ILDs, as we’ll see in the next part of the activity).
In the real world, the ambiguity would be resolved by the pinna cues mentioned in the activity introduction, and/or by moving your head slightly. Here, your auditory system appears to resolve the ambiguity by simply assuming that the sounds are coming from in front of you, although if you concentrate you may be able to convince your auditory system into hearing the sounds as coming from behind you.
Click the RANDOM LOCATION button to hear a randomly-selected sound from one of the speakers. Try to guess which direction the sound is coming from and then click on the appropriate speaker. How accurate are you?
Interaural Level Differences
Just as you did in the previous part of the activity, put your headphones on, start by clicking on the 0° speaker, then try the 90° speaker. Once again, you should first experience the sound as coming from right in front of you and then as coming from the right side of your head. However, now the perception is caused by a difference in sound levels rather than timing for the tones entering your right and left ears. More specifically, the tone entering your right ear is 21 decibels (dB)—more intense than the one entering your left ear.
Click some of the other speakers and you should find that ILDs work in much the same way as ITDs:
- As you move from 90° to 0°, ILDs decrease, and you should perceive the sound source as rotating counterclockwise towards the front.
- ILDs for sound sources behind you mirror those for sound sources in front of you (e.g., ILD for 0° = ILD for 180°, ILD for 15° = ILD for 165°).
Click the RANDOM LOCATION button to hear a randomly-selected sound from one of the speakers, and see how well the ILDs used in the demonstration match the ILDs that result from your head shape and size.
Combining Cues
Due to the physics of sound waves, ITDs and ILDs are only effective for certain frequency ranges:
- For high-frequency sounds (above 1500 Hz or so), there will be multiple sound pressure oscillations between the time the tone reaches one ear and the time it reaches the other ear. Therefore, the auditory system cannot tell whether the sound is coming from the left or the right, so it disregards ITDs for these frequencies.
- For low-frequency sounds (below about 1800 Hz), the sound waves “bend” around the head just as a wave crashes around a pier in the water, so there is little or no difference between the intensities of the sounds reaching the two ears. Therefore, ILDs are not available for these frequencies.
This is why we used a 440-Hz tone for the ITD demonstration and a 6000-Hz tone for the ILD demonstration.
Remember, though, that most sounds in the real world are complex—composed of multiple frequencies all added together, as described in the activity on Fourier Analysis in Chapter 1. As a result, real-world sound sources almost always produce effective ITD and ILD cues.
Make sure the “ITD only” radio button is clicked at left, then click on the speaker. You should hear a glass breaking over and over, and it should sound like it’s coming from the left side of your head. Here, the illusion is caused by a 640-μs time delay between the tones entering your two ears.
Now click the “ILD only” radio button (and click the speaker again if you stopped the tone previously). You should again hear the tone coming from your left, this time because of a 21-dB level difference between the tones entering your two ears.
Finally, click the “ITD + ILD” radio button. As you can guess, this combines the 640-μs ITD with the 21-dB ILD. You will probably find that this enhances the perception of the sound as coming from the left side of your head over either cue alone. But it still won’t really sound like the glass is breaking off in the distance to your left.
Remember that for vision, stereopsis is needed to make depth relations “pop out” in three dimensions. In auditory localization, ITDs and ILDs are analogous to the pictorial cues, but the pinna cues discussed in the activity introduction (and in greater detail in your textbook) are analogous to stereopsis. When you hear noises in the real world, it’s the combination of ITDs, ILDs, and pinnae cues that make the noises “pop out” in a way that they just don’t when listening to headphones alone.
Random Location
You are now hearing a randomly-selected tone. Click on the speaker corresponding to the location you perceive the tone as coming from.
Random Location Revealed
The speaker you guessed is now highlighted with a blue background, and the speaker corresponding to the tone you were hearing is now animated.
There is no “right” answer here, because the exact ILDs for different locations are determined by the size of your head. The ILDs used to generate the stimuli for this activity came from a study that averaged across a number of listeners.


