Essay 3.1 Hyperacuity
Where Are the Stripes?
Our visual systems are very good at recognizing where things are. Consider the two horizontal stripes in Image 1a. It is quite easy to tell that the right stripe is a little higher than the left one, even if you view this page from a long way away (this is a “Vernier” task). Similarly, one can quite easily discern that the middle stripe in Image 1b is a little closer to the top stripe than it is to the bottom stripe (this is a “bisection” task). These represent just two examples of a class of visual tasks that were given the label “hyperacuity” by Gerald Westheimer. What these tasks have in common is that they all involve judging the relative position of objects. Westheimer coined the term hyperacuity for these tasks because, under ideal conditions, humans can discern differences in the relative positions of objects that are smaller than the size or spacing of foveal cones!
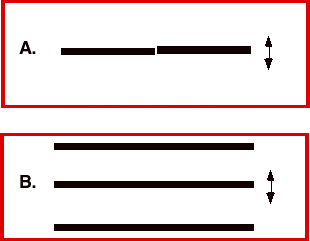
Image 1 (a) Vernier target. (b) Bisection target.
The most familiar of the hyperacuity tasks is known as Vernier acuity—named after the Frenchman, Pierre Vernier, whose scale, developed in 1631, was widely used to aid ship’s navigators. The success of the Vernier scale was based on the fact that humans are very adept at judging whether nearby markings are collinear or not (as in Image 2a). Thus, Vernier alignment is still widely used in precision machines, and even on the dial switches on modern ovens. The smallest misalignment that we can reliably discern is known as our Vernier acuity. So how small is it? Under ideal conditions, Vernier acuity may be just 3 seconds of visual angle! Note that there are 60 minutes per degree of visual angle and 60 seconds per minute. What this means is that an observer can reliably judge the direction of offset (e.g., whether the right line is shifted up or down in Image 1a) when the offset subtends an angle of just 1/1,200 of a degree on the eye! This performance is even more remarkable when you consider that even the smallest foveal cones have a diameter of about 30 seconds, and are separated from each other by about 30 seconds. Additionally, the optics of the eye blur the image of a thin line over a number of cones, and the eyes are in constant motion, making this ability truly astonishing.
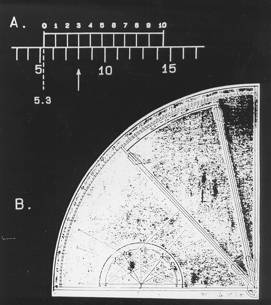
Image 2 (a) Vernier's alignment scale. (b) A Sextant incorporating the Vernier scale.
As remarkable as Vernier acuity might seem, it, and the other hyperacuities (sometimes also called “position” acuities) do not defy the laws of physics. Bill Geisler (2003) has calculated that if you placed a hypothetical machine (known as an ideal observer) at the retina, and if this machine knew precisely the pattern of photons absorbed by the retinal photoreceptors when the stripes were aligned or misaligned, then this machine could actually perform a lot better than even the best humans. So, there is sufficient information about Vernier offsets in the pattern of photons absorbed by the photoreceptors, but humans must be able to interpret the information despite the constant motion of the eyes. Several lines of evidence suggest that Vernier acuity is ultimately performed by size and orientation pattern analyzers in the visual cortex. Image 3a shows how high contrast grating masks of different orientations influence Vernier acuity. Interestingly, Vernier thresholds are most elevated (i.e., at their worst) not when the mask and target are parallel, but when the mask is oriented at about 10–15 degrees on either side of the target. This result implies that the analyzers sensitive to the Vernier offset are oriented filters tilted at an angle to the line, such that they are differentially stimulated by the offset (see Image 3b).
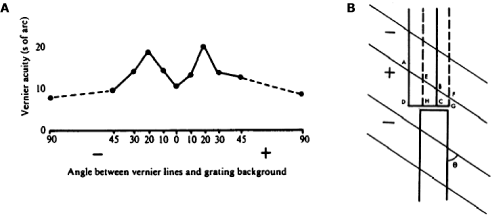
Image 3 (a) Vernier acuity with superimposed grating masks of different orientations. Higher numbers indicate worse performance. (b) The sharp threshold elevation with tilted masks implies that the analyzers sensitive to the Vernier offset are oriented filters tilted at an angle to the line.
Vernier acuity for nearby lines depends strongly on the contrast of the lines, and masking experiments reveal that Vernier acuity is tuned to orientation. Indeed, computational models, like the one described by Wilson and his colleagues for the detection and discrimination of patterns, predict many features of Vernier acuity and bisection acuity (Image 4).
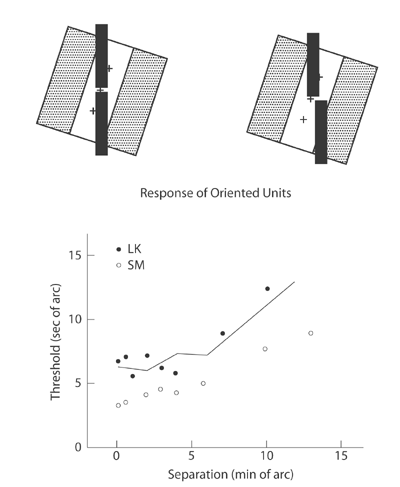
Image 4 (top) Illustrates how a receptive field tilted relative to the Vernier target would be sensitive to a Vernier offset. (bottom) Vernier acuity plotted as a function of the separation between the lines. The data are from Westheimer and McKee (1977). The solid line shows the predictions of Wilson’s model.
Weber’s Law for Position
When the lines of a Vernier or bisection target are separated by more than a few minutes of arc, thresholds begin to increase roughly in proportion to the separation of the lines (see Image 4). This is an example of Weber’s law for position: Position threshold ≈ k × separation, where k is the Weber fraction. Position thresholds for separated targets may be on the order of about 1/60 (k = 0.0167) of the separation between the target features. This means that if the separation is 10 degrees, the position threshold will be ≈ 10 minutes of arc, if the separation is 1 degree (60 minutes), then the threshold will be ≈ 1 minute of arc, and if the separation is 10 minutes of arc, threshold will be about 10 seconds of arc.
Weber’s law for position has very important perceptual consequences. Consider Image 5. The image shows three patches of horizontal grating, with the middle patch shifted down from the midpoint by a near threshold offset (1/30 of the separation). If you move toward or away from the page (i.e., decrease or increase your viewing distance), the angular separation between the patches will change, and the angular offset will vary proportionally. However, viewed from any distance, the offset will always be 1/30 of the separation, and consequently the visibility of the offset will be constant. This is known as scale invariance, and is a consequence of Weber’s law for position.

Image 5 The middle patch is shifted down by 1/30 of the separation between the patches, meaning that the downward misalignment should be visible from any distance due to scale invariance.
Position Acuity, “Local Signs,” and Eye Movements
There is a good deal of evidence that different mechanisms limit position judgments for closely spaced (or abutting) targets versus widely separated targets. In the case of closely spaced targets, both contrast and contrast polarity are important. For example, in a two-line Vernier stimulus, Vernier acuity is better when the lines are either both bright or dark than if one line is bright and the other dark. For longer-range position judgments where the targets are well separated, neither contrast, contrast polarity, nor the local stimulus details (such as spatial frequency or orientation) seem to matter very much. It seems that the visual system must localize each of the features and then compare the position labels of separate cortical mechanisms.
The idea that cortical receptive fields have position labels (in addition to labels for other stimulus dimensions) is consistent with the topographical mapping of visual space in the brain (i.e., each point in space is systematically mapped in the visual cortex). More than a century ago, Hermann Lotze wrote “So long as the opinion is maintained that the space relations of impressions pass as such into the soul, it must of course, in the interest of the soul, be further held that each impression is conveyed to it by a distinct fibre, and that the fibres reach the seat of the soul with their relative situation wholly undisturbed.” Although we now know much more about the anatomy and physiology of the visual system than was known in the 1880s, Lotze clearly recognized that there must be a topographical representation of the world in the visual nervous system (if not the soul!), and that each “fibre” must carry a label about the position of the “impression” that it carried. For this reason, position labels were called “Lotze’s local signs.” Lotze also concluded that local signs played an important role in directing eye-movements toward stimuli in the periphery. So, how accurate is “local sign” information? It turns out that humans can localize the position of a single peripheral patch to within about 1–2% of the eccentricity of the patch (White, Levi, and Aitsebaomo, 1992; Levi and Tripathy, 1996), a little more precisely than we can make saccadic eye movements to peripheral targets.
References
Geisler, W. S. (2003). Ideal observer analysis. In L. Chalupa and J. Werner (Eds.), The Visual Neurosciences (pp. 825–837). Boston: MIT Press.
Levi, D. M., and Tripathy, S. P. (1996). Localization of a peripheral patch: The role of blur and spatial frequency. Vision Res 36: 3785–3803.
Westheimer, G., and McKee, S. P. (1977). Spatial configurations for visual hyperacuity. Vision Res 17: 941–947.
White, J. M., Levi, D. M., and Aitsebaomo, A. P., (1992). Spatial localization without visual references. Vision Res 32: 513–526.