Essay 3.3 Seeing Images on the Cortex
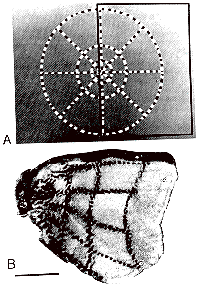
Image 1a shows a stimulus that was shown to a monkey and Image 1b shows the pattern of activation that stimulus created in area V1. The three rings in Image 1a appear as three approximately vertical stripes that are more or less equally spaced on the cortex in Image 1b. Note, however, that the rings are not equally spaced in the original stimulus: They are logarithmically spaced—that is, if ring 1 has a radius of 2.5 degrees, then ring 2 will have a radius of 5 degrees, and ring 3 will have a radius of 10 degrees. Each doubling of the distance in visual space is represented by an approximately equal distance on the cortex. The rays—which represent the vertical, horizontal, and oblique medians in Image 1a—appear as the horizontal stripes that are more or less parallel on the cortex.

Image 1 (a) The pattern used to activate cells in V1 of a monkey. (b) The three rings in a appear as the three vertical stripes which are more or less equally spaced in b, the 2-deoxyglucose image on the cortex.
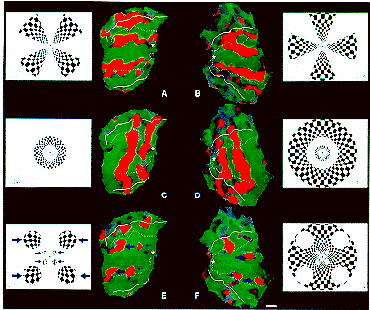
The “picture” of the stimulus on the monkey cortex shown in Image 1b was obtained by using a radioactively labeled substance (known as 2-deoxyglucose or 2-DG) which is taken up by the cells that respond to the target. It is also possible to obtain “pictures” of the human cortex using several new brain imaging techniques, such as positron emission tomography (PET) and, more recently, functional magnetic resonance imaging (fMRI). Both PET and fMRI provide signals that indirectly reflect neural activity. For example, if you were to view a target (like an annulus containing flickering checks), some neurons in your visual cortex would be selectively activated. This increased neuronal activity would require more oxygen from the blood supply around the most active neurons, and the fMRI signal is sensitive to such differences in the local concentration of blood oxygen. Image 2 illustrates how annuli filled with checks “light up” or activate the human visual cortex. Despite the fact that these techniques provide an indirect measure of brain activity, by using carefully controlled stimuli and clever techniques for enhancing the signals, it is possible to learn a lot about human brain function. For example, these techniques make it possible to determine whether specific regions in the brain are sensitive to certain types of stimuli. In addition, by knowing the size and eccentricity of the visual stimulus, it is possible to infer the human cortical magnification factor.

Image 2 Patterns used to activate neurons in human visual cortex. The activity is determined indirectly using a technique called fMRI, and is shown by the color maps of the cortex.