Essay 2.1 Seeing Illusory Stripes and Spots
Mach Bands
Seeing is not always believing. Sometimes our eyes play tricks on us, and the illusions that we see can be quite informative about the neural operations that the visual system carries out. One well-known visual illusion was described by Ernst Mach (1838–1916), the famous Austrian physicist whose name is attached to the units that describe the speed of sound. Image 1a below shows the visual illusion that bears Mach’s name. The illusion is known as “Mach bands” because there is an illusory bright stripe in the region marked “B” and an illusory dark stripe in the region marked “D.” These bright and dark stripes (Mach bands) are illusions formed by the visual system.
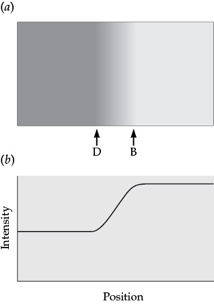
Image 1 Mach bands. (a) This visual illusion gets its name from the illusory bright stripe in the region marked “B” and the illusory dark stripe in the region marked “D.” (b) The actual intensity distribution of the Mach pattern illustrates a luminance ramp edge. (Part a from Cornsweet, 1970.)
The actual intensity distribution of the Mach pattern, shown in Image 1b, is initially constant, increases smoothly over a short distance, and then remains steady at the new (higher) level. This intensity pattern is a luminance ramp edge, which contains no bright or dark stripes. Rather, the vivid perception of bright and dark stripes comes from operations performed by the visual nervous system instead of from the visual stimulus. This is an example where you can’t believe your eyes—the perceptual brightness of the pattern varies where its physical intensity does not!
In 1865, when Mach first reported his observations, we had very little direct knowledge about the visual nervous system; however, Mach suggested that the illusory stripes were produced by lateral inhibition in the retina. This notion gained wide support following the discovery of center–surround antagonistic receptive fields in the retina. This type of explanation, illustrated in Figure 2.15 of the textbook, has been popular for about the last 50 years.
In textbook Figure 2.15, the concentric circles represent ON-center retinal (or LGN) receptive fields (RFs). The RF on the left receives less light than the one on the right. If these receptive fields inform the brain about the intensity of light falling within their RFs, the brain will get the message that the left side of the picture is dimmer than the right side. However, an important consideration is the amount of light falling on each region of the receptive field, the center and the surround. Consider the middle RF in Figure 2.15. Its center falls within the left half of the pattern; however, part of the antagonistic surround falls within the brighter right half. Thus, the middle RF will receive more surround antagonism, and therefore its response will be lower than the response of the RF on the left. The perceptual result will be that the region just to the left of the luminance step will appear as a darker stripe (or Mach band). The bright Mach band would be explained by an RF that had its center just within the bright panel but part of its antagonistic surround in the dimmer left half. The result would be less antagonism compared with the rightmost RF (where the entire surround is in the bright panel), and the perceptual consequence would be a brighter stripe (or Mach band).
Although this simple “classic” explanation feels good, it is not the full story, and a complete understanding of Mach bands (and other similar perceptual illusions) will likely require a theory involving stages beyond the retina (for an excellent review, see Pessoa, 1996). For example, the classic theory fails to explain why Mach bands are less obvious at step edges than they are at ramp edges like the one shown in Image 1b. However, the Mach band phenomenon reminds us that our visual system does not simply passively transmit information about the intensities of objects; it acts on that information in ways that often sharpen edges and contours.
Hermann Grid
When you look at Image 2a below, you might notice “phantom” spots in the intersections between the black squares. You may even have the strange feeling that the spots know when you are trying to look right at them, and disappear so that you can’t. These illusory spots were discovered by Ludimar Hermann, and the Hermann grid illusion is named after him. You can find several really cool examples of this illusion on the web at michaelbach.de/ot/lum_herGrid/.
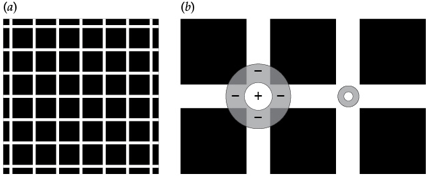
Image 2 (a) Hermann’s grid. Illusory spots are seen at the intersections between the black squares, except the ones you are looking at directly. (b) The classical explanation is based on the center–surround RFs of the retina. When the ganglion cell RF center (+) is positioned at a crossing (left), there are 4 bright patches in the inhibitory surround, which reduce its firing and result in the illusion of a dark spot. When viewing directly (right), the RFs are small, so it doesn’t matter much where they land.
As for Mach bands, the classical explanation for the Hermann grid illusion is based on antagonistic center–surround receptive fields (Image 2b). As illustrated in the left side of Image 2b, the inhibitory (negative) surround of the receptive field in the crossing is stimulated by four bright patches (shown by the four minus signs), so it will be strongly inhibited, resulting in the perception of the dark spot. Why do the spots disappear when you try to fixate them? The standard explanation is that the foveal receptive fields are much smaller, so the entire receptive field fits within the crossing. Like the explanation for Mach bands, the simple center–surround receptive-field explanation for the Hermann grid illusion is likely to be an oversimplification, as noted by Michael Bach (michaelbach.de/ot/lum-herGridCurved/index.html).